Trend Seasonality Cycles Noise
Trend, seasonality, cycles, and noise are a vocabulary for separating different kinds of temporal structure. A common additive view is
where is long-run movement, is regular calendar repetition, is slower irregular cyclic behavior, and is residual variation. Multiplicative decompositions use products instead of sums when seasonal amplitude grows with the level.
Trend is directional movement over a period relevant to the decision. It may be deterministic, such as a planned rollout, or stochastic, such as a random walk-like level. Seasonality is tied to a known period: hour of day, day of week, month of year. Cycles are recurrent but not fixed to a precise calendar period, such as business-cycle demand. Noise is the part left after the modeled structure, but “noise” can still reveal missing drivers, outliers, or regime changes.
| Component | Period | Example | Captured by |
|---|---|---|---|
| Trend | none fixed; long-run | adoption growth, planned rollout | differencing, smoothing trend states |
| Seasonality | fixed and known | day-of-week, month-of-year | SARIMA seasonal lags, calendar features |
| Cycle | recurrent, not calendar-fixed | business-cycle demand | slow states, exogenous drivers |
| Noise | none | irregular residual variation | nothing by design; check residual autocorrelation |
These components affect model choice. SARIMA is appropriate when seasonal dependence is regular and captured by seasonal lags. Exponential smoothing handles level, trend, and seasonal states directly. Feature engineering for forecasting can encode holidays, events, and multiple seasonalities when a pure univariate model is too restrictive.
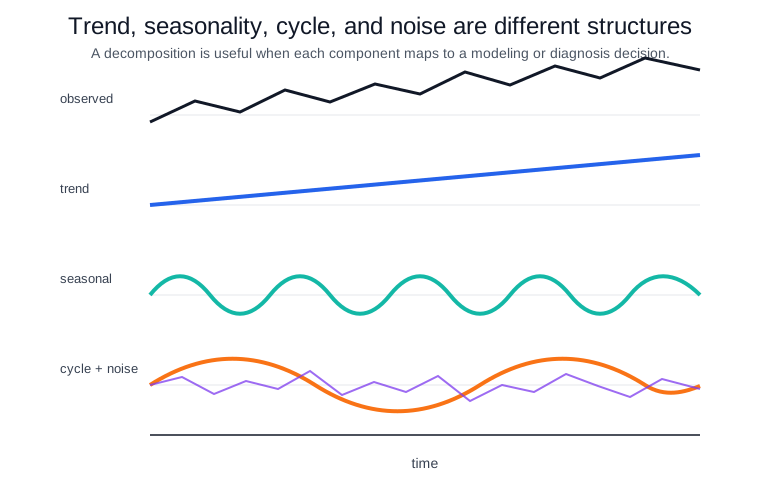
The diagram separates components that are often mixed in the raw series. The trend changes the long-run level, the seasonal component repeats at a fixed period, the cycle moves more slowly without a fixed calendar alignment, and the residual is the remaining irregular variation.
Decomposition is descriptive unless it improves forecasting or diagnosis. A visually pleasing trend line can leak future data if computed over the full sample before validation. Seasonal plots can hide changing seasonal strength. Residual plots should be checked with autocorrelation and partial autocorrelation, and any modeling choice should be validated with forecast evaluation.
References
- Hyndman & Athanasopoulos, FPP3: Time series decomposition
- Hyndman & Athanasopoulos, FPP3: Time series patterns
Nav